
A “Mild Recession”
A good post-Thanksgiving read from Friday’s WSJ op-ed section by none other than former Fed Vice Chair Alan Blinder — The Fed Has Good Reasons to Slow Rate Increases on page A15. He provides the salient point that over the past four months, the pace of consumer price inflation has eased to a +2.8% annualized rate from the comparable +12.2% burst over the prior four month period. He makes it clear that if he were still on the Committee, he would be voting for 25 basis points at the mid-December meeting. His focus in the piece is the new discussion over policy lags, which is finally gaining the momentum it deserves. As Alan put it:
“[…] we are now experiencing the earliest small traces of the Fed’s tightening. Much more is in the pipeline […] fortunately, many members of the FOMC understand that danger, which is one reason why I expect the 2023 recession to be mild.”
There it is. The cat is out of the bag. Those two words — “mild recession.” That may sound soothing, but mild recessions are problematic on their own since their mildness means little pent up demand for the next recovery. Remember what the early 1990s looked like after that mild recession — it took nearly three years for the economy to embark on a significant recovery (recall Alan Greenspan’s “50-mile-an-hour headwinds” reference). We had the mildest recession of all time in 2001 and that proved to be one of the most brutal bear markets in modern history.
Not Exactly a Stellar Statistic
From what I’m seeing and hearing, it is looking like the early numbers on YoY Thanksgiving sales growth is running close to a lukewarm 2.5% pace. In other words, negative in volume terms. And that’s with blowout credit card usage and rampant “buy now, pay later” schemes. See A Black Friday Full of Deals, And Wariness on the very front page of the Saturday NYT. As for inflation, online prices have actually deflated 0.7% year-over-year because of “early holiday sales” and an environment where “bargain-hunting seemed to have the power.” Maybe also have a glance at The Glut Before Christmas on page B1 of the weekend WSJ. What’s the Fed’s excuse going to be to hike at all in the coming months when it becomes so painfully obvious that inflation is going to come crashing down?
Lip Service
I see in my trusty WSJ a reference to the good old Lipstick Index, created by former Estée Lauder CEO Leonard Lauder back, oh at least two decades ago. What he found was that lipstick sales are a classic contra-cyclical indicator. A small luxury women purchase when times are too tough to go out and buy a dress. Thing is — lipstick sales are up a smacking +37% in the year to October! Their gloss comes at every other retailer’s loss.
Other Interesting Reads of the Day
It’s not just durable goods prices that have been volatile amid pandemic-related supply chain issues. The Wall Street Journal showed this weekend that Globalized Supply Chain Brings More-Turbulent Food Prices. While globalization has helped improve productivity, expand choice for consumers, reduce production costs, and lower food prices, the disruptions of supply chains threaten to unwind those benefits. Shortages of crucial inputs, such as energy and fertilizer (made worse by the pandemic and then Russia’s war in Ukraine), are keeping food prices higher than would otherwise be the case.
In Stocks Are on the Rise, but Earnings Could Drag Them Down Again, the WSJ warns about complacency amid the recent uptick in equities. Consensus is looking for earnings growth of over 5% for 2023, which looks like a stretch considering the vulnerability of corporate profits to the upcoming economic downturn.
The WSJ explains why single-family home rentals are among the fastest-growing sectors in real estate in its weekend piece As Mortgage Rates Rise, More People Choose to Rent Single-Family Homes. Homes built for rental purposes now account for 11% of all single-family home construction, up from the 3% or so that was typical over the last few decades, and is poised to further increase its share of construction as high mortgage rates push more households away from ownership and towards rentals.
In Seven days that could unravel the global oil market, the Financial Times looks at the possible impacts of the upcoming sanctions by the European Union on Russian oil. The new sanctions will stop European companies (which dominate the global insurance market for oil tankers) from insuring ships carrying Russian oil to third countries unless there’s a price cap on that oil. That could lead to Russia curtailing its output and, depending on OPEC’s decision to offset any shortfall (or not), could end up raising oil prices. The oil price surge could be even more brutal if demand picks up e.g., China eases its COVID-19 restrictions next year.
While a dull global economic outlook does not look positive for copper, Nikkei Asia adopts a rather optimistic tone in Copper’s green future keeps miners bullish despite China weakness. According to the paper, demand will find support amid the ongoing push towards decarbonization — recall that the red metal is used in a range of green technologies — while supply may be restrained considering investment in the sector has fallen off in recent years.
Xi Jinping has a tough decision to make on China’s COVID protests according to Nikkei Asia. Unlike past localized unrests, which were easily quashed by suppression from Beijing, current anti-lockdown protests are nationwide and are targeting Xi himself. The President seems to be faced with two bad options: 1) Continue with “Zero Covid” and address the protests with the usual repression, which would risk the situation deteriorating into something even bigger or 2) End the “Zero Covid” policy, although that would not just be humiliating for Xi (who imposed the policy in the first place) but worse, could be seen as weakness from the President, raising odds of further demonstrations in the future.
Credit Tightness
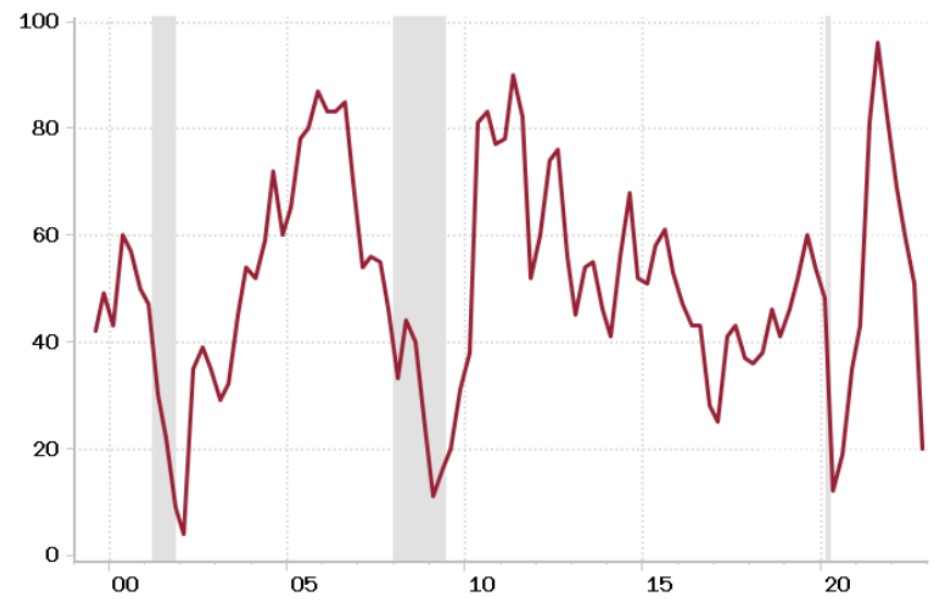
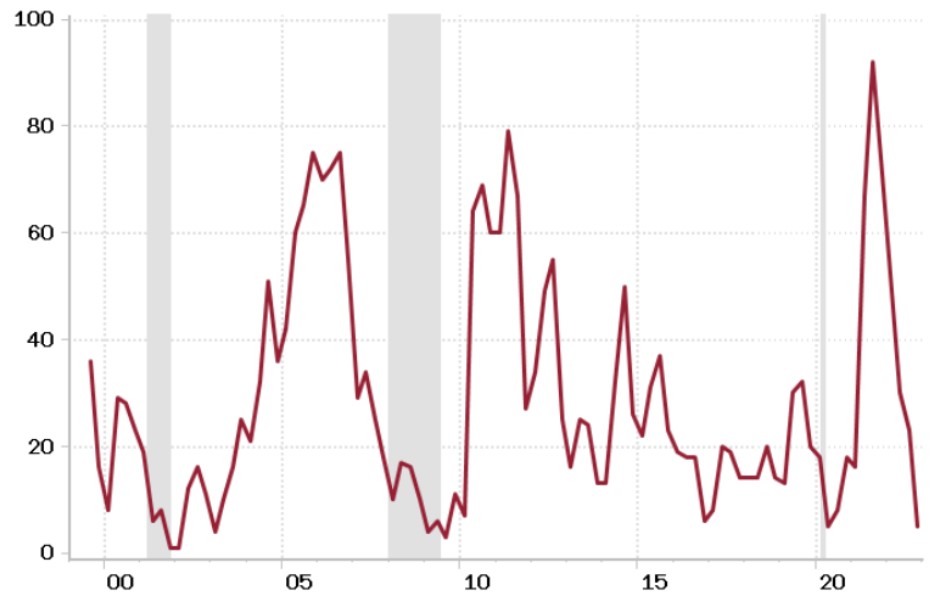
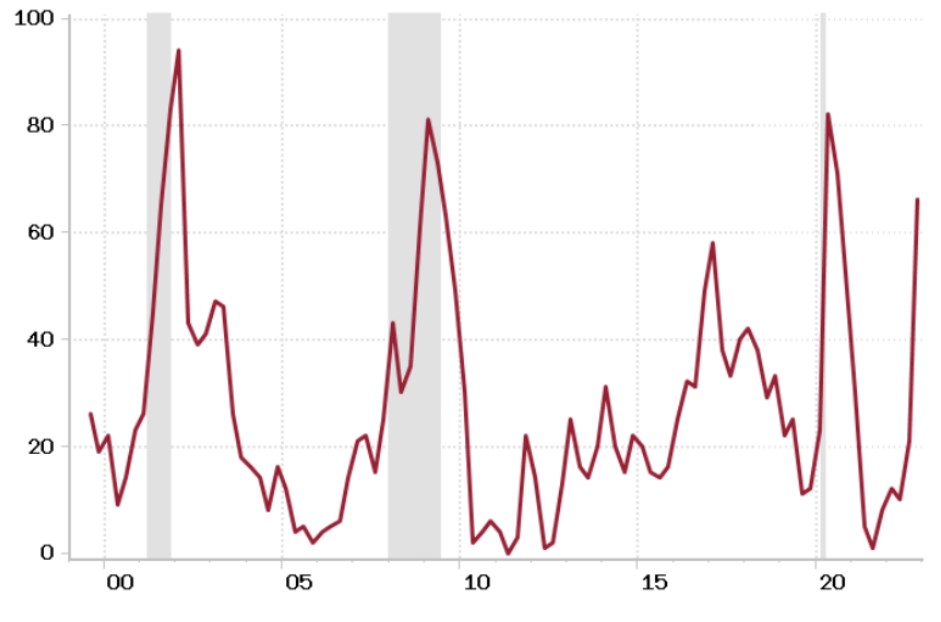
Signs of credit tightness are starting to surface, as they invariably do as recessionary pressures intensify. The National Association of Credit Managers (NACM) index sagged from 55.6 in September to 53.2 in October, the lowest (as in, most stringent) level since June 2020. New credit applications are also back to recession-like June 2020 levels. And the credit extension measure is down to where it was in July 2020. Credit application rejections are at their highest since February. Bankruptcy and credit disputes have both hooked up. The data gave the “stay away” label when it comes to the financials.
CHART 1: NACM Survey of Credit Managers
United States
(index; >50 denotes expansion)
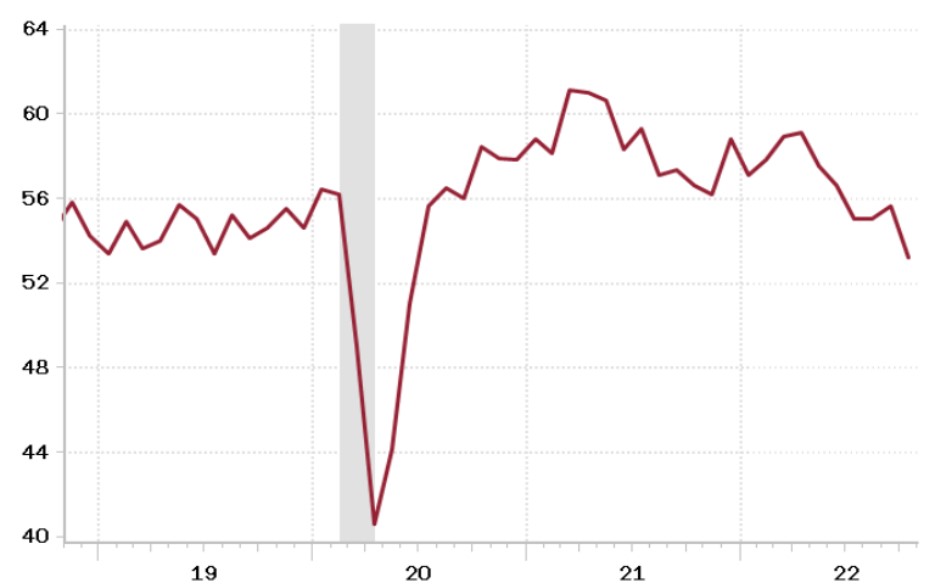
Shading indicates recession
Source: Haver Analytics, Rosenberg Research
CHART 2: New Credit Applications
United States: Credit Managers’ Index
(index; >50 denotes expansion)
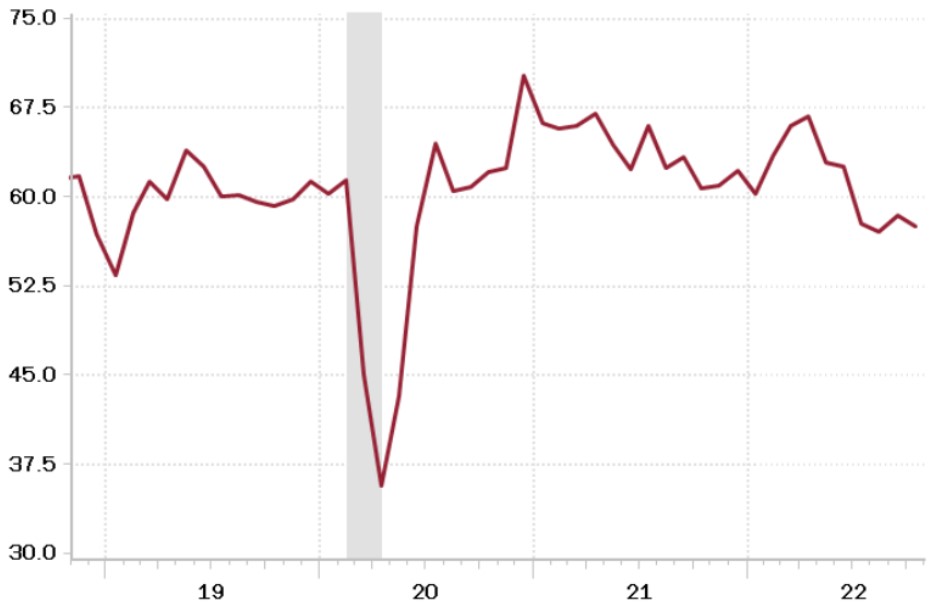
Shading indicates recession
Source: Haver Analytics, Rosenberg Research
CHART 3: Amount of Credit Extended
United States: Credit Managers’ Index
(index; >50 denotes expansion)
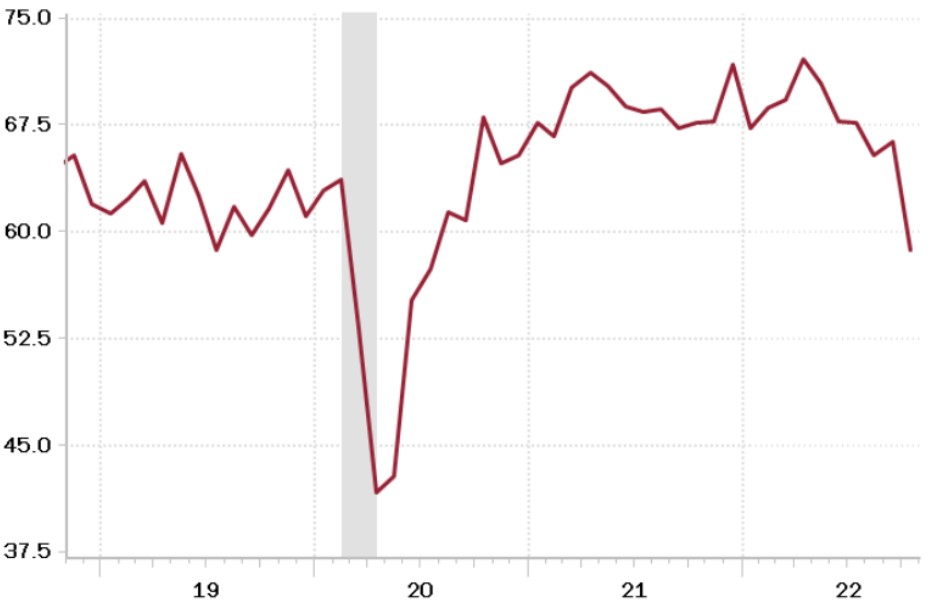
Shading indicates recession
Source: Haver Analytics, Rosenberg Research
Preparation!
U.S. consumer spending has been better than many had expected based on fundamentals such as real disposable income and sentiment (both of which have been falling amid surging inflation). The latest research from the Federal Reserve Bank of Kansas City tries to elucidate this conundrum, and provides clues about future consumption. The Kansas City Fed modeled the relationship between consumption growth and its determinants — i.e., real disposable income, sentiment, and savings — and used that model to predict consumption growth in Q2 and Q3 of this year. Its model suggests consumption growth should have been near-zero in both quarters — i.e., well below the 2% or so annualized growth observed from actual data. The Kansas City Fed attributes this gap to an unusual disconnect between sentiment and consumption − sinking sentiment may have reflected consumer discontent about rising prices rather than actual intentions to spend. But it cautioned:
“[A]lthough these relationships seem to have broken down during the pandemic, they are likely to normalize as pandemic-era effects, such as high excess savings, fade. As excess savings run down amid weak real income growth, consumers will likely become much more selective in their purchases and not make purchases when they feel it is a bad time to buy, which could lower consumer spending meaningfully and, in turn, weigh on inflation.”
Indeed, with a savings rate of just 3.1% in September — i.e., near 14-year lows — it will be a tough slog for consumers going forward, even before considering the negative wealth effects from imploding housing and stock markets. And since consumption accounts for nearly 70% of GDP, its upcoming slowdown is bound to tip an already-fragile U.S. economy into recession sooner rather than later. The arguable best strategy, under this scenario of weak growth and declining inflation, is to seek exposure to fixed income instruments, which are currently very attractive relative to equities.
RENTAL MARKET SHIFTING TO OVERSUPPLY
No sooner than I said last week that multi-family units under construction have soared to their highest level since December 1973 than we saw confirmation of the rental rate thaw in the Q4 survey from the National Multifamily Housing Council. Here is the pattern of late (lower numbers denote reduced supply tightness):
- 2021Q3: 96
- 2021Q4: 82
- 2022Q1: 69
- 2022Q2: 60
- 2022Q3: 51
- 2022Q4: 20
That 20 figure is the lowest since 2020Q3 when I can guarantee you that nobody was talking about the rent components of the CPI!
CHART 4: Apartment Market Conditions: Market Tightness Index
United States
(index; >50 denotes tightness)
Shading indicates recession
Source: Haver Analytics, Rosenberg Research
The subindex on looseness in the market over the past three months is back to 2020Q3 levels but what is really nifty is the other measure of tightening in the past three months is tied for the lowest since 2009Q3. We are not going to have to wait much longer to see these CPI rental metrics begin to slow and help recreate the conditions, already evident in the tradable goods sector, for a repeat of a classic 2008-09 swing from inflation to deflation. They all said I was nutso for calling for deflation at the peak of the commodity supercycle then, and they are saying the very same thing now.
CHART 5: Apartment Market Conditions: Tighter United States
(percent)
Shading indicates recession
Source: Haver Analytics, Rosenberg Research
CHART 6: Apartment Market Conditions: Looser United States
(percent)
Shading indicates recession
Source: Haver Analytics, Rosenberg Research
WITHIN HIGH YIELD, EMPHASIZE BB EXPOSURE WITH RECESSIONARY PRESSURES ON THE RISE
In our view, financial markets have become increasingly sanguine about the prospect of recession, which is perhaps most apparent in the tightening in high yield (HY) spreads of late. Indeed, at their peak levels this year (back in July), HY spreads reached 600 basis points. However, since then, spreads have compressed to 457 basis points, which ranks in just its 45th percentile historically. In other words, the market is pricing in average default prospects, which strikes us as overly complacent in light of what we see as rising recession risks. After all, based on the 2s/10s curve, recession probabilities have now reached a level that has presaged all prior economic downturns. Against this backdrop, we believe investors should limit HY exposure to BB credits, which are less at risk during deteriorating economic environments.
CHART 7: Recession Probabilities Have Reached a Level that Foreshadowed Each Downturn United States
(percent)
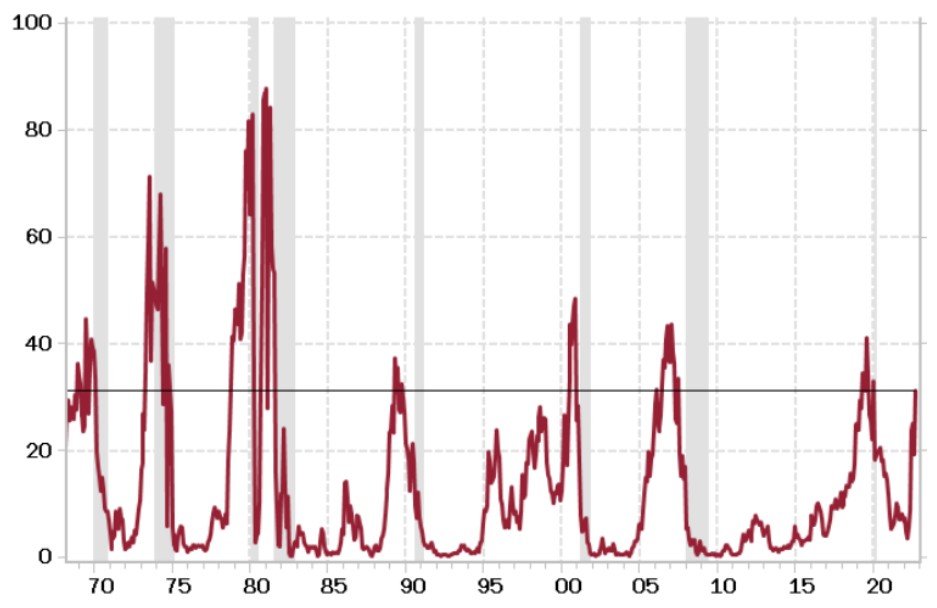
Shading indicates recession
Source: Haver Analytics, Rosenberg Research
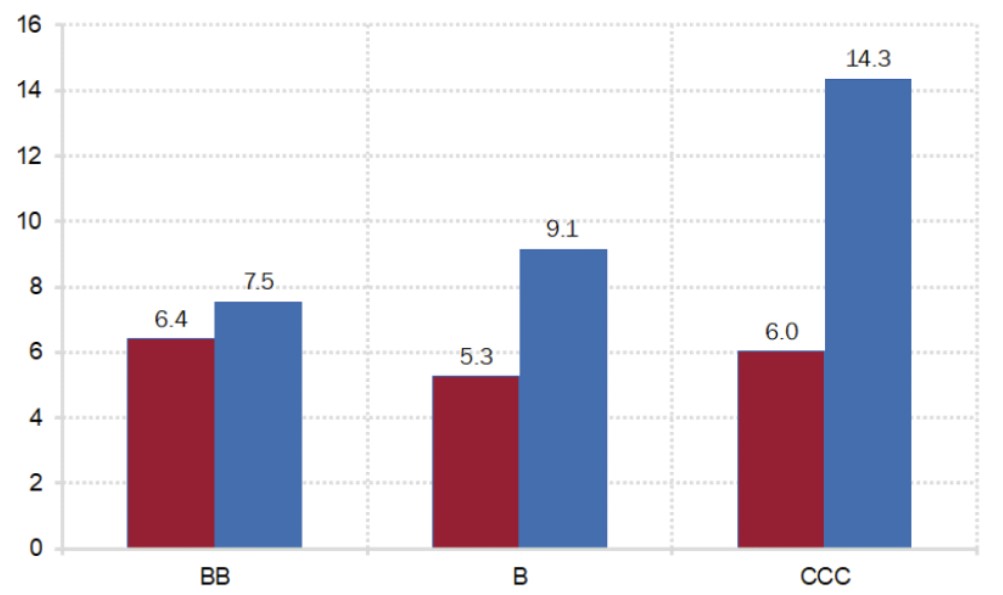
Historically, the ICE BofA BB index has not only outperformed the comparable single-B and CCC indices on a risk-adjusted basis, but it has a superior absolute return. This is shown in the chart below — since 1997, the total return of BB bonds has amounted to +6.4% (annualized) compared to +5.3% for single-B bonds and +6.0% for CCC credit. And critically, it has achieved this return stream with much less volatility — BB has 20% lower volatility than single-B and 50% less volatility than CCC bonds.
CHART 8: Since 1997, BB Has Outperformed and with Less Volatility
United States
(red line; annualized return; percent)
(blue line; annualized volatility; percent)
Source: Bloomberg, Rosenberg Research
With this in mind, a buy and hold investor concerned with maximizing their risk-adjusted return will generally benefit from gravitating towards BB credits. This is not to say that superior returns cannot be achieved by taking on additional credit risk — but rather, investors have to be very selective and tactical when taking on this exposure. In other words, we believe this credit segment is better suited for active — rather than passive — investors that are able to take advantage of opportunities that arise once the risk/reward profile becomes more compelling.
As the chart below shows, these periods tend to be coming out of major cyclical slowdowns and/or recessions (as the credit cycle turns). Of note, the relative return of CCC versus BB bonds has a 70% correlation with the ISM manufacturing PMI, highlighting just how tied performance is towards the trajectory of the economy. Indeed, from the major troughs in the ISM manufacturing PMI to the peaks, CCC bonds outperform BB bonds by 19.6% (on average at an annualized rate) — for context, in all other periods, CCC bonds have underperformed BB by 7.8 percentage points (again, at an annual rate). Put differently, the time to take on additional credit risk is coming out of a downturn, not when recessionary pressures are on the rise (as is currently the case).
CHART 9: CCC Tends to Only Outperform BB Coming out of Major Cyclical Troughs United States
(red line; ISM manufacturing PMI; index; >50 denotes expansion; RHS)
(blue line; CCC total return index divided by BB total return index; ratio; LHS)
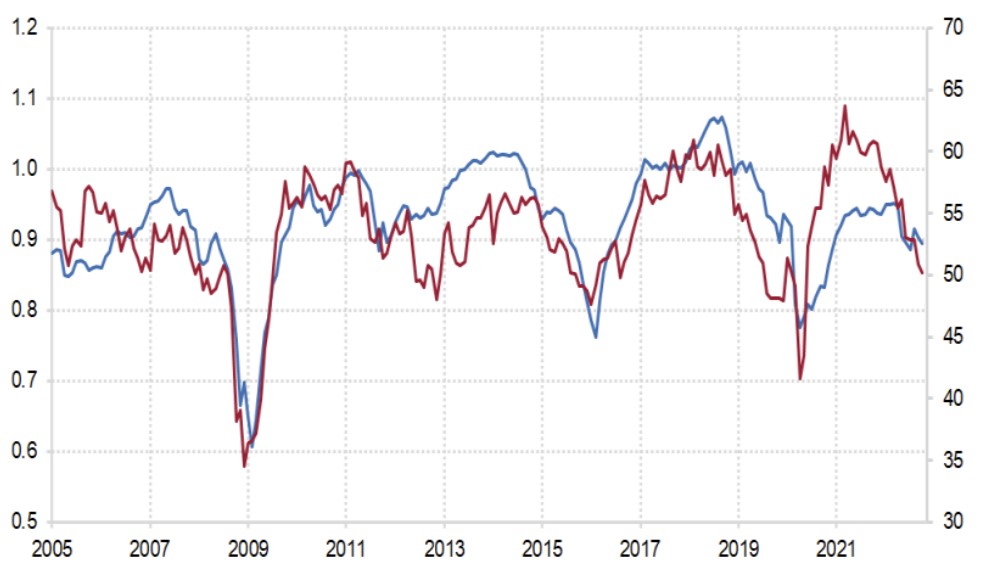
Source: Bloomberg, Rosenberg Research
Another element making us wary of taking on additional credit risk within high yield is that, based on current spread levels, the market is pricing in average default prospects. Historically, there is a fairly strong relationship between HY spreads and subsequent defaults over the next year, which we show in the scatterplot below — as an example, CCC spreads have a 45% r-squared with annual default rates since 1988. Plugging in current spread levels — across BB, single-B, and CCC — into their respective regressions results in a projected annual default rate of 0.6% for BB, 3.1% for single-B, and 25.4% for CCC. In each case, these rates are about average historically, but below what transpires during recessions. Therefore, with leading economic indicators continuing to deteriorate, and spreads not yet discounting a recessionary default rate, we believe investors — even active ones — are best served by emphasizing BB exposure within high yield.
CHART 10: CCC Spreads Imply Average Default Prospects
United States
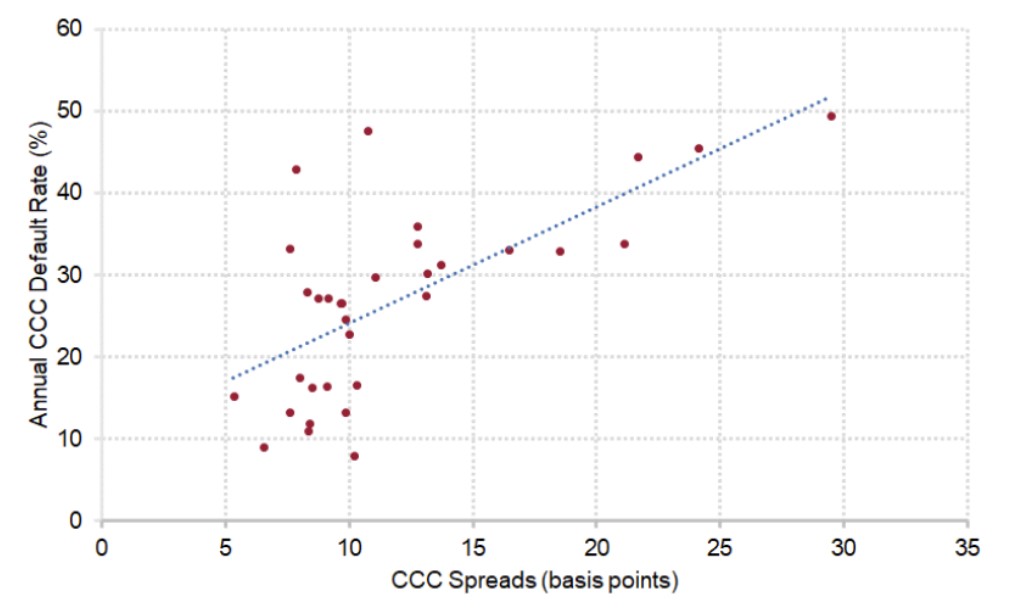
Source: Bloomberg, Rosenberg Research
Bottom line, with the Fed continuing to tighten policy — albeit at a slower rate — into a deeply inverted yield curve, we believe now is not the time to gravitate towards the most speculative credits. Only when economic activity troughs, spreads have appropriately discounted a higher default rate, and monetary policy moves from a headwind to a tailwind, is it appropriate for active investors to dial up their risk within high yield. As for passive investors, they will also be best suited by focusing on BB due to its superior return profile over the long-term, and with less volatility to boot. If, as we expect, the credit cycle is in the early stages of turning, the riskiest credits have the most downside at current levels.
CORPORATE GUIDANCE CASTING ANOTHER CLOUD ON THE OUTLOOK
With the third quarter earnings season coming to a close — as 97% of S&P 500 companies have reported — we remain focused on how expectations are evolving, given our belief that consensus estimates remain far too optimistic. While this view is driven by our internal models, we decided to also take a look at how guidance straight from companies themselves has come in relative to expectations. To be sure, not all companies engage in providing this information to investors. But, for the management teams that continue to provide updates on how they view the next quarter (as in, for the fourth quarter earnings season that will commence in the new year) and/or the full fiscal year for earnings per share, revenue, and capex, the news is disappointing — especially for many retailing and technology-related companies such as Target, Amazon, Dollar Tree, AMD, Nvidia, and Facebook (among others). Add on the stream of announcements when it comes to job cuts and overall cost cutting, and it is a clear indication that forward consensus estimates still have further to fall.
Utilizing available Bloomberg data, we ran a screen of S&P 500 companies that have provided guidance since the end of the third quarter resulting in a list of 376 companies. Not all information provided by management is uniform in nature — some only set expectations for the coming quarter, while others only focus on the full fiscal year. Additionally, between EPS, sales, and capex, companies may only provide insight into one of these metrics. Nonetheless, based on the information provided, we gathered forward guidance estimates across all of the aforementioned timelines and metrics, and compared it to what consensus expectations were from the analyst community one-day prior.
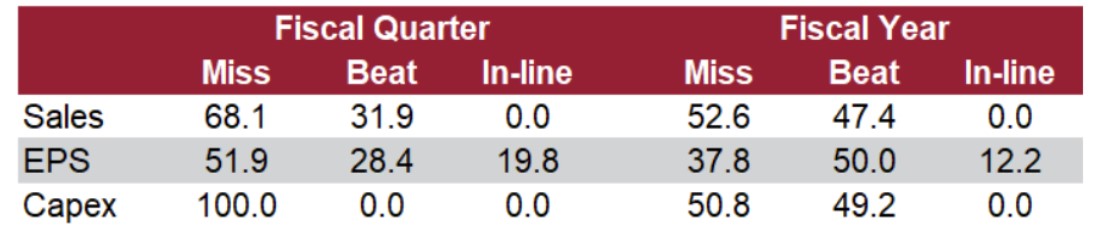
Summarizing the results into the table below, there is an immediate pattern that emerges between the fiscal year outlook and for the quarter. For full-year forecasts, due to the better than expected start to 2022, as the lagged effects of the re-opening trade, pent-up savings, and lingering fiscal/monetary policy support provided an upside surprise, there is a roughly even split between company guidance that beat expectations and those that missed across revenue, EPS, and capex. However, when looking at the quarterly forecasts provided, which would cover the fourth quarter earnings season, there is a notable deterioration… to the tune of 70% of company guidance missing estimates on the sales side; 52% for earnings; and a whopping 100% for capex (though this is just seven companies, to be fair). Overall, the ratio of “misses” to “beats” jumps from approximately 1:1 on a fiscal year basis, to a 2:1 ratio in favor of missing the consensus on the downside for Q4.
TABLE 1: Notable Weakness in Guidance to End the Year
United States: Share of companies providing an outlook missing, beating, or meeting expectations
(percent)
Source: Bloomberg, Rosenberg Research
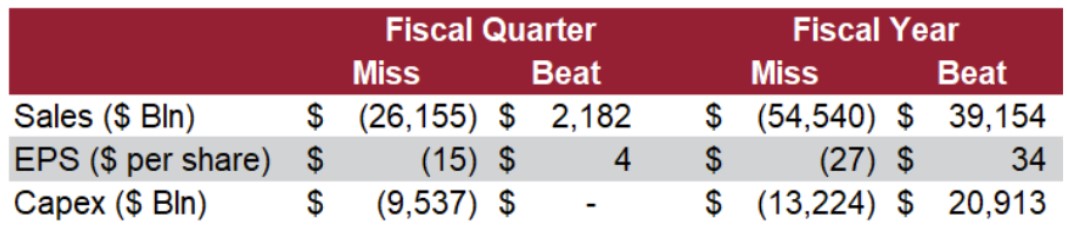
We can re-run the same analysis, but instead of looking at forward guidance on an absolute basis, we can analyze the aggregate dollar value of management teams that provided a projection that was below or exceeded expectations. Broadly speaking, and particularly true for companies providing a quarterly outlook, the value of those that have come in lower than expected has dwarfed those that bested the consensus number. For example, the total value of Q4 revenue expectations that have come in below what analysts were expecting was a whopping $26 billion… compared to just $2.1 billion in total beats. For EPS, the cumulative miss has come in at $15 per share, compared to just $4 in above consensus outlooks.
TABLE 2: Aggregate Dollar Amount of Misses Dwarfs Beats
United States: Aggregate dollar amount of misses, beats, and in-line guidance
Source: Bloomberg, Rosenberg Research
This matches the trend emerging from the stream of news articles announcing corporate layoffs and other cost cutting measures to rein in expenses, which have increased in frequency of late — confirming how the weakness is really starting to show up as we end 2022. Notable examples include Amazon (10,000 job cuts), Cisco (5% job cuts; $600 million restructuring), Disney (company-wide cost cuts, layoffs, and hiring freeze), Facebook (11,000 job cuts), Microsoft (~1,000 job cuts; plans to rein in spending)… and the list goes on. On an aggregate basis, just look at the Challenger data regarding layoff announcements — running at a +50% YoY pace as of the end of October — and the Manpower hiring intentions data for Q4 2022 sinking to a five-quarter low. Additionally, running a Bloomberg screen of news articles with the keywords “job cuts” and “costs” reveals a notable uptick in mentions, with the number of hits running at +24% compared to this time last year (at nearly 400k articles) and in-line with the +26% surge experienced at the height of the COVID-19 pandemic in early 2020.
Given our in-house view of an economy that has slowed dramatically in the face of increasing recessionary pressures, this is not entirely surprising. And while the analyst community has begun to take note — revising their projections for 2023 some 3% lower since September for S&P 500 EPS and -1% for revenues — we continue to believe that this is just the beginning. This process should intensify as we move into next year, with management focusing their outlooks on 2023. For markets, we believe this will ultimately fuel the next leg lower in risk assets and provide better buying opportunities for investors as the consensus digests the stream of negative guidance coming from company management teams.
ISI Newsletter is the best source for self-directed investing and building your own income securities portfolio. Subscribe to receive monthly recommendations and investment strategies from Editor & CEO Martin Fridson.
IMPORTANT DISCLOSURES
This report comments on the economy and capital markets. The opinions are those of the author as of the date of the report and are subject to change without notice. Rosenberg Research & Associates Inc. (Rosenberg Research) will not necessarily update the report in the event facts or opinions change.
This report is for discussion purposes only.
Although Rosenberg Research may provide commentary relating to investment approaches and opportunities to buy or sell securities, you should not construe such commentary as legal, tax, investment, financial or other advice. Nothing contained in any Rosenberg Research report or any other content on our web site constitutes a solicitation, recommendation, endorsement, or offer to buy or sell any securities or other financial instruments. Consult your own advisors if you require such advice.
This report should not be regarded by recipients as a substitute for the exercise of their own judgement and readers are encouraged to seek independent, third party research on any companies discussed or impacted by this report.
This report is not a research report under applicable U.S. rules and regulations.
Rosenberg Research does not guarantee the accuracy of any information in this report. This report may contain links to third-party websites. These links are provided as a convenience only. By providing these links, Rosenberg Research is not expressly or impliedly endorsing or approving these other sites, nor warranting or guaranteeing the content of the materials on such sites or the services or products that may be offered on such sites.
Rosenberg Research reports are distributed simultaneously to internal and client websites and other portals by email and are not publicly available.
