

Best Risk-Return Credit Profile: A Short-Dated A-BBB Barbell
There has been a significant re-pricing in the bond market this year, as the Fed has aggressively pushed up interest rates across the curve. In terms of the credit market, the effect of this has been two-fold: i) there has been a corresponding parallel shift upward in investment grade yields (on account of higher underlying Treasury yields) and ii) credit spreads have widened to account for growing recessionary prospects (due to the Fed’s tightening cycle). As a result, the yield-to-worst (the lowest potential yield — assuming no default — that a bondholder could receive on a callable bond) on investment grade bonds has risen to 5.70% from 2.36% at the turn of the year. This upward yield shift has meaningful implications for return prospects — we have found that, in the case of IG bonds, the starting yield has a 78% r-squared in terms of explaining realized returns over the next five years. In other words, the outlook for annual returns in the investment grade universe has gone from low-single digits at the start of the year to mid-single digits currently. But, not all segments of IG are equally attractive — our analysis suggests that, on a risk-adjusted basis, bonds with a maturity of 1-3 years screen the most favorably, specifically A and BBB-rated credits.
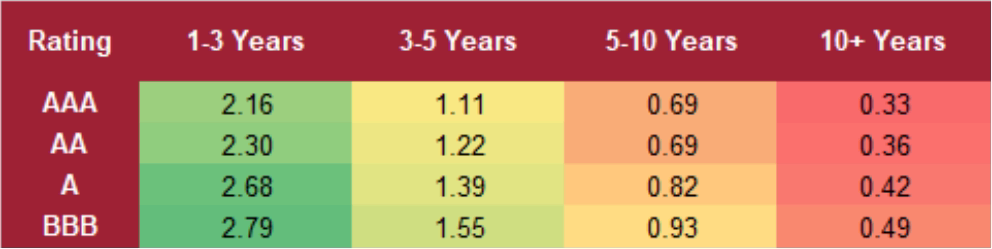
We looked at several factors in our analysis. The first metric we considered was the “Sherman ratio,” which is named after DoubleLine Capital Deputy Chief Investment Officer Jeffrey Sherman. This ratio looks at the amount of yield investors earn for each unit of duration — in essence, a measure of interest rate risk. A Sherman ratio of 1.0 means that it would take a 100 basis point increase in interest rates over one year to offset the yield on the bond. As you can see in the table below, many segments of the IG space have a ratio above 1.0, with BBB-rated bonds — with a maturity of 1-3 years — having the most attractive score (2.79). Next on our list would be A-rated bonds (2.68), again at the front end of the credit curve (i.e., 1-3 years). On the other side of the spectrum, AAA bonds, with a maturity of 10+ years, have the lowest yield cushion to absorb a potential interest rate shock.
TABLE 1: Based on the Sherman Ratio, BBB-Rated Bonds with a Maturity of 1-3 Years Screen the Best
United States (ratio)
Source: Bloomberg, Rosenberg Research
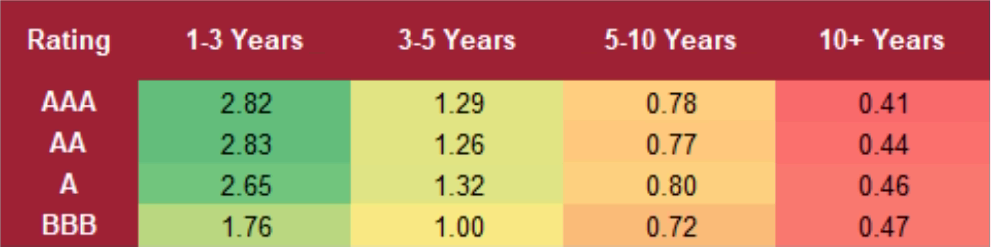
The second metric we considered was the current yield divided by the historical annualized volatility of returns (over the past five years). The idea here is that, the higher the volatility, the higher the yield should be to compensate investors for taking on additional risk. On this basis, 1-3 year AA bonds are the most appealing, with a ratio of 2.83. Conversely, as was the case with the Sherman ratio, 10+ year AAA bonds screen the worst and have a ratio of just 0.41. These results suggest that broadly speaking, investors are better off emphasizing the front-end of the credit curve, given the attractive yield that can be garnered, and with limited volatility to boot.
TABLE 2: Relative to its Historical Volatility, 1-3 Year AA Bonds Have the Most Attractive Yield United States
(ratio)
Source: Bloomberg, Rosenberg Research
Finally, no analysis of the credit market would be complete without taking spreads into consideration. Unfortunately, at this level of granularity, the Bloomberg credit indices only have complete data back to the beginning of 2018, which only gives us about five years’ worth of spread data. Nonetheless, there are some interesting insights that can be gleaned — for example, A-rated bonds, across all maturities, have spreads that are currently in their 90th+ percentile over this period. This suggests that, relative to other segments of the credit market, there is more bad news that is being discounted. Looking ahead, given our expectation of a further increase in spreads (as recessionary pressures intensify), we would look to emphasize segments of the credit market that have gone the furthest towards pricing in an economic downturn. Based on this analysis, A-rated bonds best fit this description.
TABLE 3: A-Rated Bonds Look the Most Appropriately Priced Based on Credit Spreads United States
(percentile rank)
![]()
Source: Bloomberg, Rosenberg Research
Taking all three of these factors into consideration concurrently — the Sherman ratio, the yield relative to historical volatility, and credit spreads — paints a clearer picture of the ultimate “winner” in our analysis. As you can see in the table below, A-rated bonds, with a maturity of 1-3 years, screen the best overall followed by BBB-rated bonds with the same maturity.
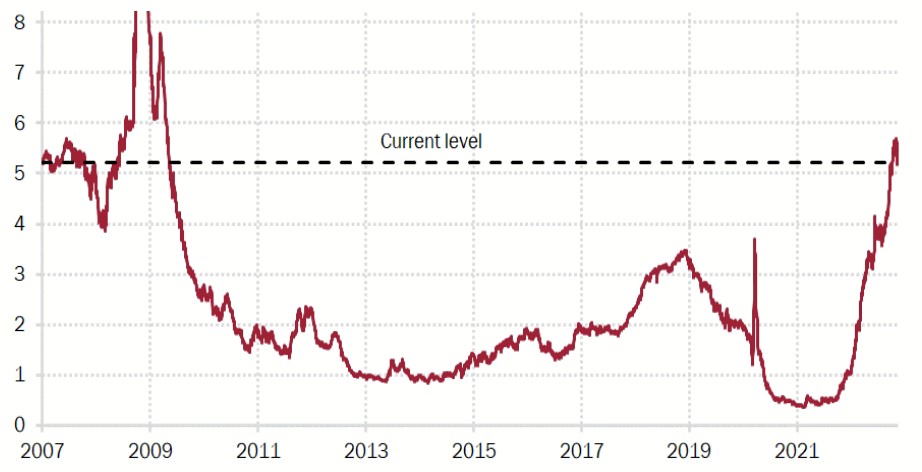
Next on our pecking order would again be A/BBB credit but at the 3-5 year maturity. Note that the yield-to-worst on these indices ranges from 5.22% (1-3 year A credit) to 5.67% (3-5 year BBB credit). From our standpoint, this potential return profile looks quite appealing, especially relative to the risk (volatility) assumed.
TABLE 4: Focus on the 1-3 Year Maturity, Specifically A and BBB-Rated Credit United States
(overall rank)
![]()
Source: Bloomberg, Rosenberg Research
CHART 1: The Most Attractive Yield Since Mid-2009!
United States: Yield-to-worst; A-rated credit (1-3 year maturity)
(percent)
Source: Bloomberg, Rosenberg Research
Bottom line — we believe investors can achieve mid-single digit returns in the investment grade bond market, with comparatively muted volatility (especially relative to stocks). Specifically, our analysis indicates that a short-dated A-BBB barbell screens the best at the current time. In the face of elevated macroeconomic risks, we view this segment of the credit market as a very attractive option for investors that are looking to maximize their risk-adjusted return and are wary of adding meaningful risk to their portfolio with recessionary pressures on the rise.
ISI Newsletter is the best source for self-directed investing and building your own income securities portfolio. Subscribe to receive monthly recommendations and investment strategies from Editor & CEO Martin Fridson.
IMPORTANT DISCLOSURES
This report comments on the economy and capital markets. The opinions are those of the author as of the date of the report and are subject to change without notice. Rosenberg Research & Associates Inc. (Rosenberg Research) will not necessarily update the report in the event facts or opinions change.
This report is for discussion purposes only.
Although Rosenberg Research may provide commentary relating to investment approaches and opportunities to buy or sell securities, you should not construe such commentary as legal, tax, investment, financial or other advice. Nothing contained in any Rosenberg Research report or any other content on our website constitutes a solicitation, recommendation, endorsement, or offer to buy or sell any securities or other financial instruments. Consult your own advisors if you require such advice.
This report should not be regarded by recipients as a substitute for the exercise of their own judgment and readers are encouraged to seek independent, third-party research on any companies discussed or impacted by this report.
This report is not a research report under applicable U.S. rules and regulations.
Rosenberg Research does not guarantee the accuracy of any information in this report. This report may contain links to third-party websites. These links are provided as a convenience only. By providing these links, Rosenberg Research is not expressly or impliedly endorsing or approving these other sites, nor warranting or guaranteeing the content of the materials on such sites or the services or products that may be offered on such sites.
Rosenberg Research reports are distributed simultaneously to internal and client websites and other portals by email and are not publicly available.
